Clothing Consumption Infographic
Infographic Design 2026
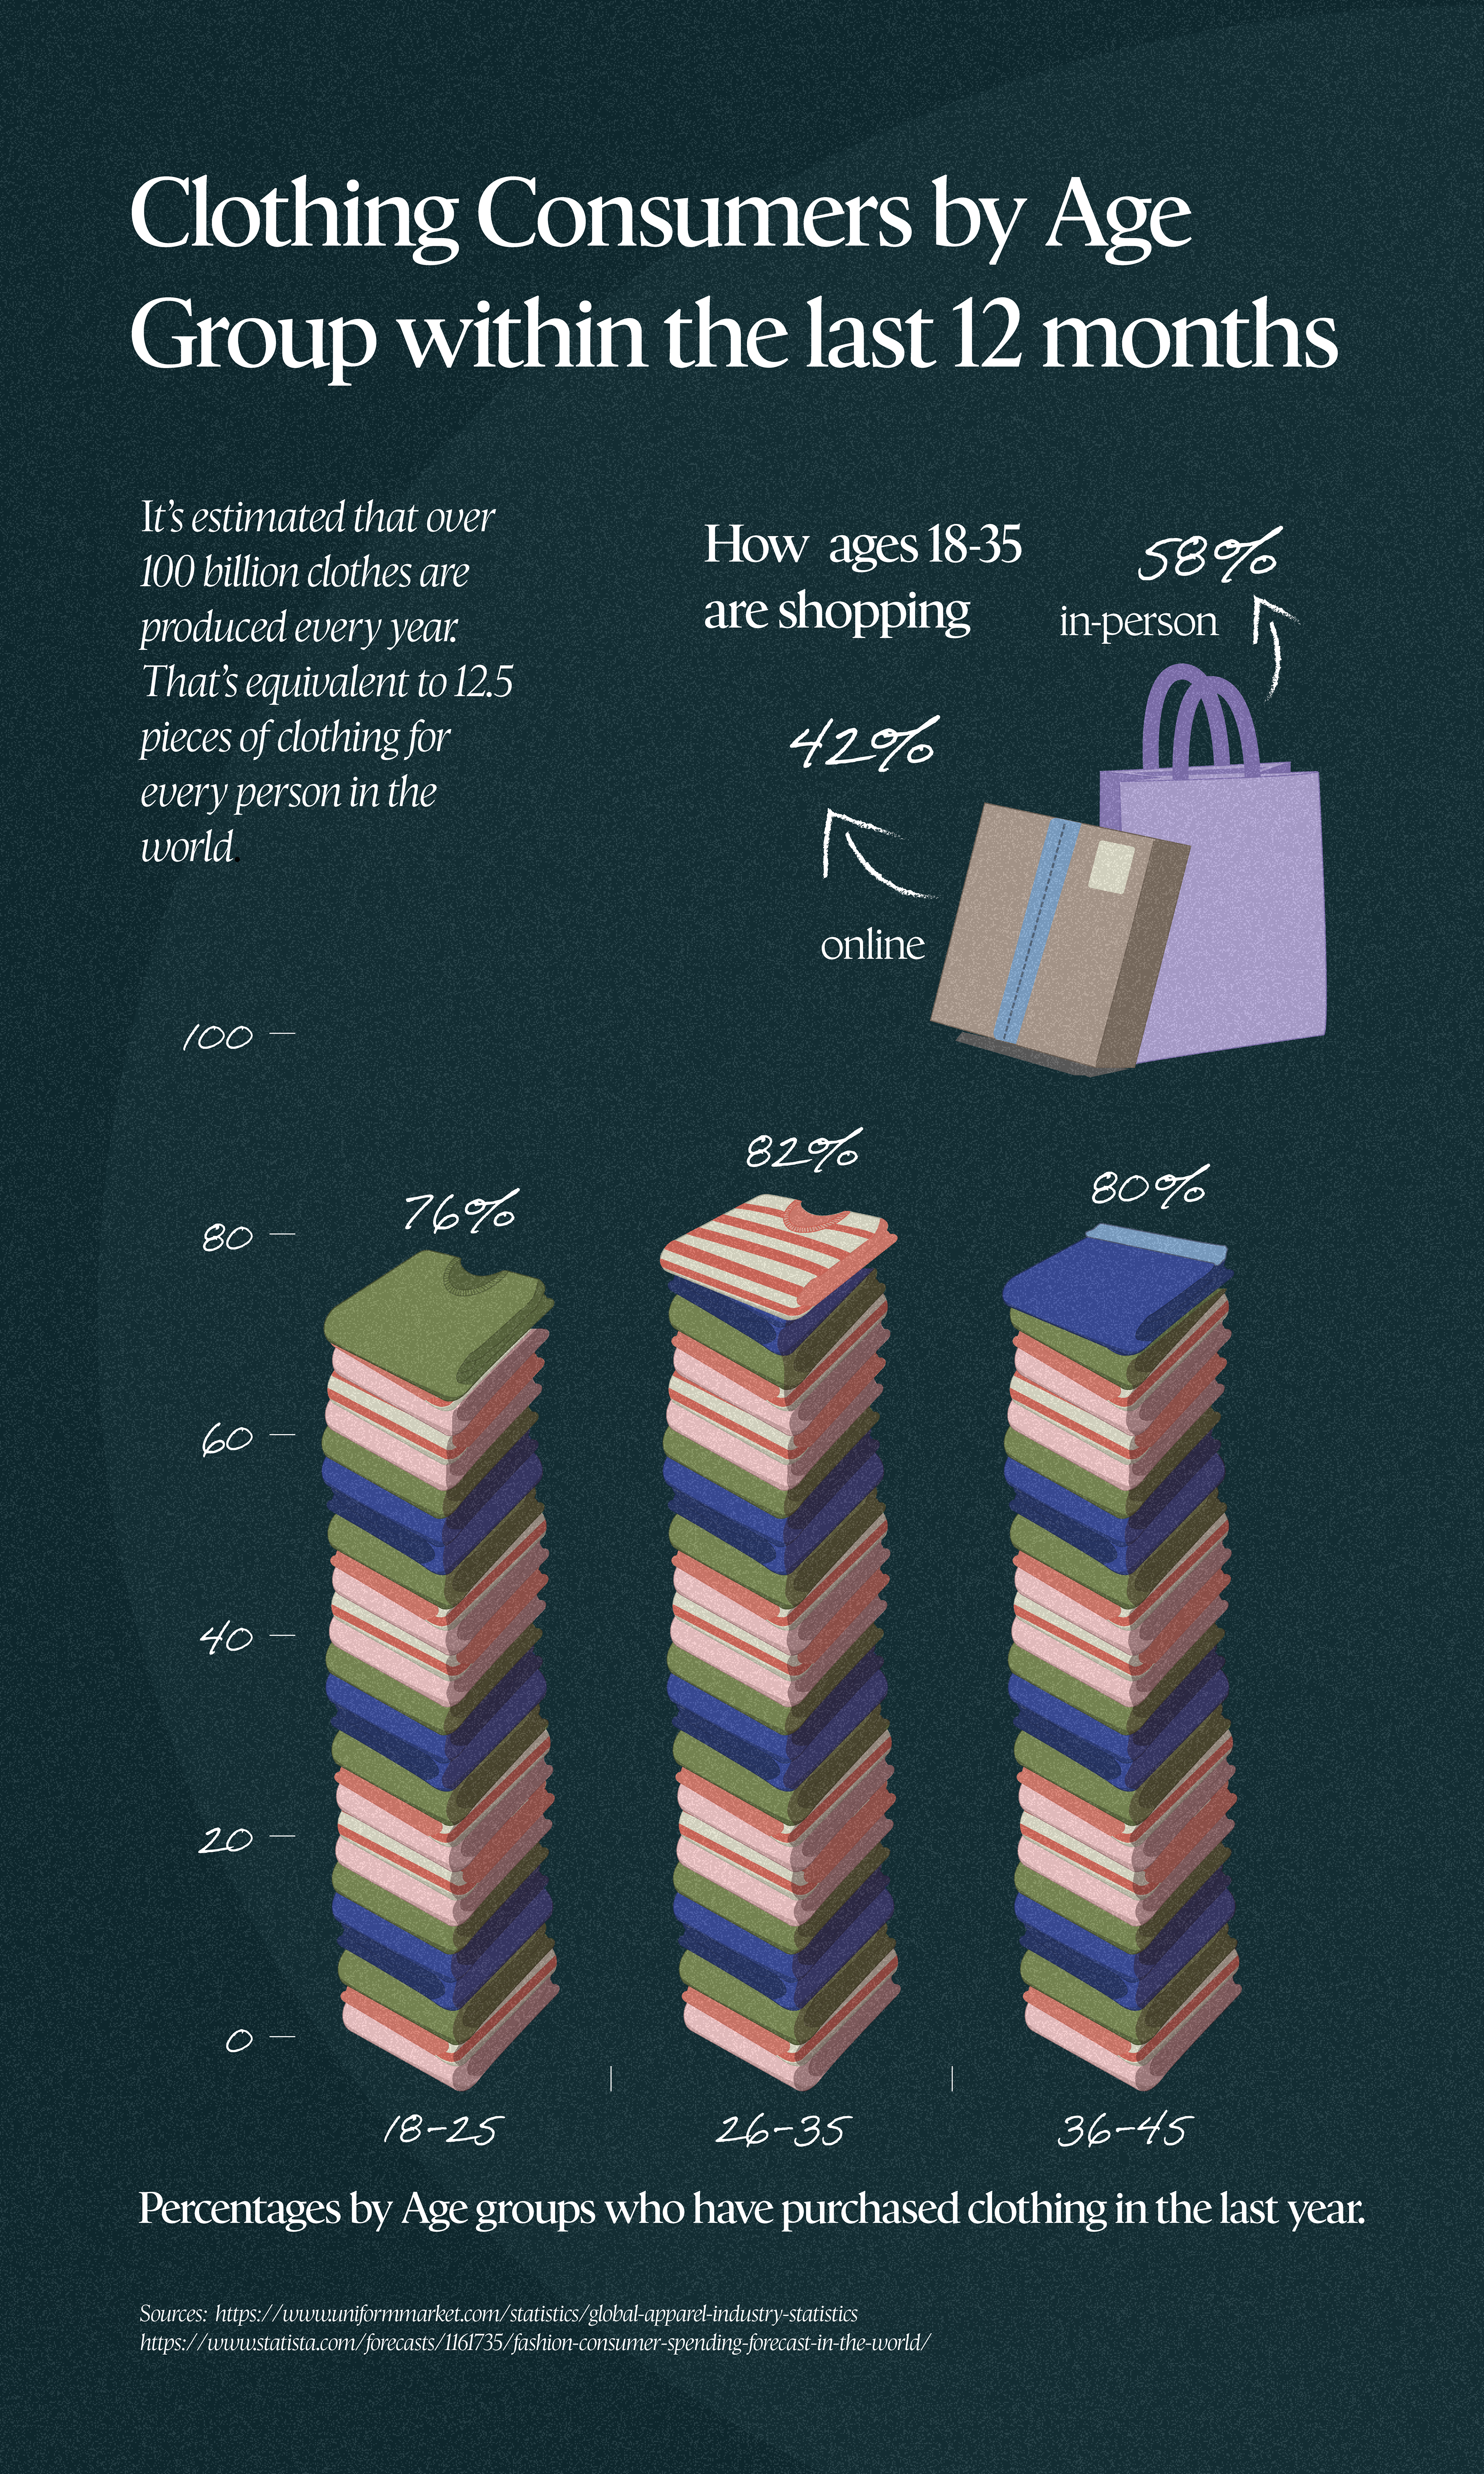
Brief was to create an infographic utilizing creative illustration techniques to transform a bar and pie chart.
The infographic details the rise in fast fashion and consumption metric for consumers.
This illustrated infographic highlights the age groups who consume the most clothing per year and how many have shopped for clothing within the last year via the bar chart of folded clothing stacked onto of each out. The pie chart is disguised as the box and shopping bag, indicating the percentage of how shoppers prefer to get their clothes (online and in-store).